


What is a Trading Journal? Benefits, Examples & How to Use One
Last Updated: December 19, 2025
I've logged more than 500 trades in my trading journal over the past three years, and I can point to several mistakes I would probably still be making if I hadn't started writing them down.
One pattern became obvious after reviewing my first few months of trades: I was entering too early whenever I thought I might miss a move. At the time, those entries felt like quick decisions. Looking back at dozens of them side by side, the pattern was impossible to ignore.
That's where a trading journal changed my perspective.
A trading journal is more than a list of entries and exits. It captures the thinking behind every trade, making it easier to spot habits, measure progress, and learn from both wins and losses.
In this guide, I'll explain what a trading journal is, why experienced traders rely on one, what you should record, and how to build a journal that actually helps you become a better trader.
What Is a Trading Journal?
At its core, a trading journal is a record of every trade you take. It goes beyond basic numbers like entry price, exit price, and profit or loss. A good journal also captures why you entered the trade, how you managed it, and whether you followed your trading plan.
I like to think of it as a conversation with my future self. A chart can tell me what happened. My journal reminds me why I made the decision in the first place.
A typical trading journal includes details such as:
The asset traded (stocks, forex, crypto, futures, or options)
Entry and exit prices
Position size
Stop-loss and take-profit levels
The trading setup or strategy
Screenshots of the chart before and after the trade
Market conditions
Emotions before, during, and after the trade
Lessons learned
The format doesn't matter nearly as much as consistency. Some traders prefer a notebook. Others use Excel, Google Sheets, or dedicated journal software. The best trading journal is simply the one you'll keep updating after every trade.
Why every trader needs a Trading Journal?
For a long time, I thought I could remember my trades. I couldn't.
I realized this after reviewing more than 100 trades from a three-month period. I could clearly remember a handful of big winners and painful losses, but I had almost no memory of the ordinary trades in between.
That's when I understood the problem with relying on memory. I wasn't reviewing my trading performance. I was reviewing the few trades my brain had decided were worth remembering.
I'd remember the big winners. I'd replay the painful losses. Everything in between slowly disappeared. After a few weeks, I was relying on memory instead of facts, and memory has a funny way of protecting our ego.
A trading journal removes the guesswork.
Instead of saying, "I think I'm good at breakout trades," you can check your records and see whether the numbers agree. Maybe breakout trades produce a 58% win rate, while reversal setups barely break even. That's the kind of insight you won't get by scrolling through old charts.
A journal also helps you spot habits that quietly drain your account. You may find that you:
Enter trades too early.
Move your stop-loss after the market turns against you.
Close profitable trades out of fear.
Trade more often after a losing streak.
Ignore your own rules during volatile market sessions.
These patterns rarely show up after one or two trades. They become obvious after reviewing dozens or even hundreds of entries.
Another benefit is accountability.
It's easy to blame the market after a bad trade. It's much harder to ignore the truth when your journal shows you broke your own rules three times in the same week. That kind of feedback can be uncomfortable, but it's often where real improvement begins.
Winning traders don't avoid mistakes. They study them. A trading journal gives you a structured way to do exactly that, turning every trade - good or bad, into useful data for the next one.
How does a Trading Journal improve trading performance?
Most traders look at profit and loss first. I used to do the same.
The problem is that a profitable trade isn't always a good trade, and a losing trade isn't always a bad one. A trading journal shifts the focus from results to decisions. Over time, that simple change can improve how you trade far more than chasing the next "perfect" setup.
This isn't just a personal observation. The idea of measuring trading performance over a large sample is widely accepted in professional trading. According to the Van Tharp Institute, traders should evaluate a trading system over at least 30 trades, while 100 to 200 trades provide a much more reliable picture of a strategy's expectancy. Looking at a handful of trades often leads to misleading conclusions because short-term results are heavily influenced by randomness.
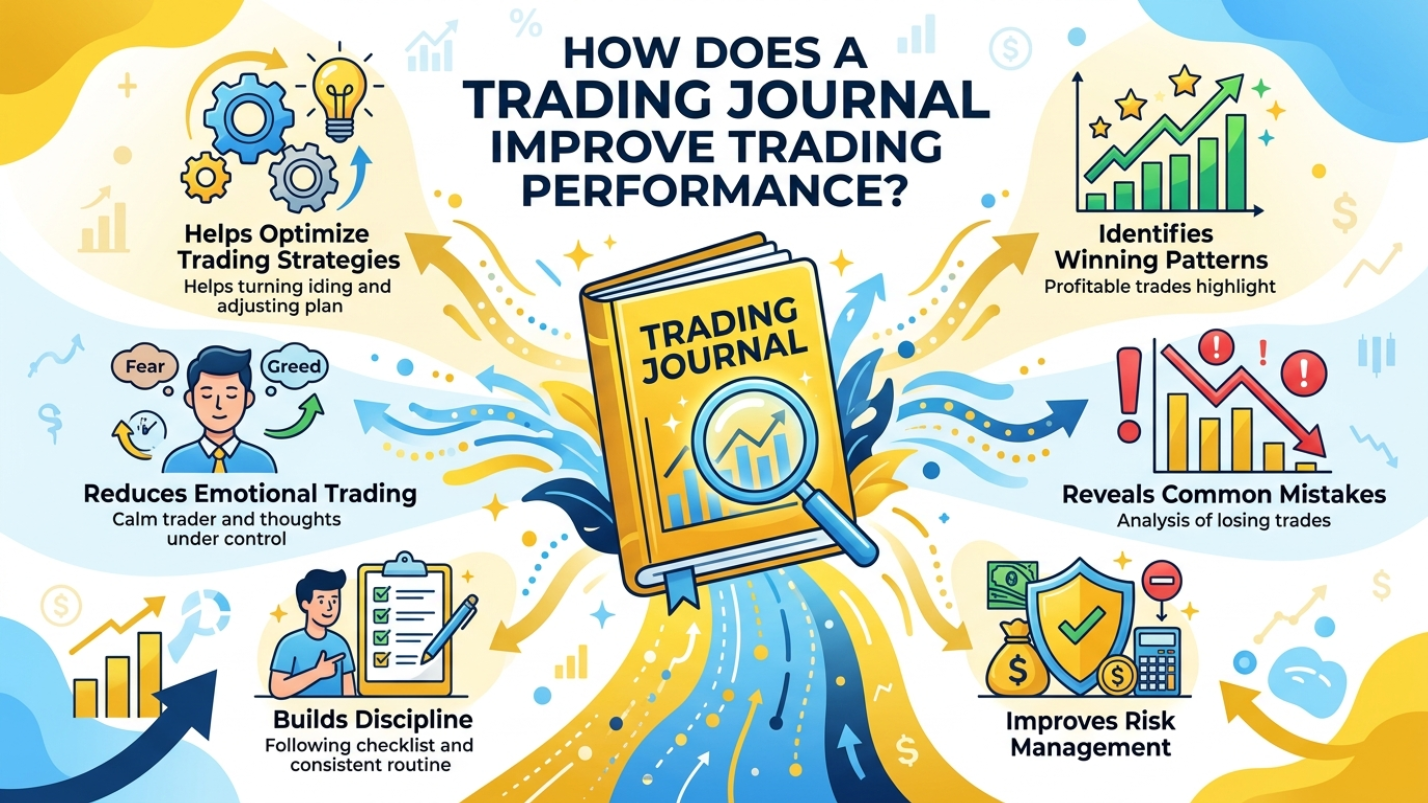
Identifies winning patterns
One winning trade doesn't prove much. Fifty trades start to tell a story.
When I reviewed more than 200 trades over a three-month period, I noticed something I had completely missed while trading. My highest-quality setups were heavily concentrated in the first two hours of the London and New York sessions.
Trades taken during those windows produced a noticeably better win rate and average R multiple than trades I entered later in the day. The difference was large enough that I eventually stopped treating every hour of the trading day as equally valuable.
That wasn't obvious while I was watching the charts. It became obvious after looking at the data.
Your journal might reveal different patterns, such as:
One strategy consistently outperforms the others.
Certain assets fit your trading style better.
Your average winning trade lasts longer than you expected.
Specific market conditions produce stronger results.
These insights help you spend more time on what already works instead of constantly searching for a new strategy.
Reveals common mistakes
Most trading mistakes aren't dramatic. They're repetitive.
Maybe you enter a trade before your setup is complete. Maybe you move your stop-loss because you "just need a little more room." Maybe you revenge trade after a loss.
I've caught myself doing all three.
Without a journal, those mistakes felt random. In one three-month review, I found the same mistake in 17 separate trades: I was entering before my confirmation signal appeared. The trigger wasn't the market. It was my own behavior after a frustrating trade.
Writing down the reason behind every entry makes those habits much harder to ignore.
Improves risk management
Risk management isn't something you fix after a bad week. It's something you measure every day.
A trading journal makes that easier.
Instead of looking only at your account balance, you can track metrics that actually explain your performance, including:
Average risk per trade
Risk-to-reward ratio
Win rate
Average profit versus average loss
Maximum losing streak
Largest drawdown
I found a similar pattern in my own journal. After reviewing more than 100 trades, I noticed that my largest losing days often came after I increased my position size following a winning streak.
The strategy itself hadn't suddenly stopped working. My risk had changed.
That was a useful reminder that sometimes the problem isn't the setup you're trading. It's the amount of money you're putting behind it.
Builds discipline
Every trader has rules.
Following them is the hard part.
During one month, I logged 14 trades that I initially considered entering but ultimately skipped because they didn't meet my checklist. Looking back, several of those setups would have been losses. It's surprisingly difficult to write, "Entered because I was afraid of missing out."
That extra moment of accountability often stops impulsive trades before they happen.
Over time, your journal becomes more than a record. It becomes a habit that reinforces patience, consistency, and respect for your trading plan.
Reduces emotional trading
Fear and greed never disappear completely.
The goal isn't to eliminate emotions. It's to stop them from making your decisions.
One habit that helped me was adding a short note after every trade. Sometimes it was only a sentence:
"Felt impatient."
"Hesitated because of the previous loss."
"Entered earlier than planned."
After reviewing 87 trades, I found that a noticeable portion of my worst entries happened within 30 minutes of missing a setup I had originally planned to take.
The market didn't change. My emotional response did.
Once you recognize those patterns, they're much easier to manage.
Helps optimize trading strategies
Many traders abandon a strategy after a few losing trades.
I've done that more than once.
Looking back, some of those strategies weren't failing at all. I was applying them in the wrong market conditions.
A trading journal helps separate strategy problems from execution problems. If the data shows that a setup performs well in trending markets but struggles during sideways price action, you can adjust when you use it instead of throwing it away completely.
That's one of the biggest advantages of keeping detailed records. Every review gives you another chance to refine your process, make small adjustments, and let real data guide your decisions instead of frustration or guesswork.
What should a Trading Journal include?
One question I hear a lot is, "What exactly should I write down?"
My answer is always the same: record enough information so that, six months from now, you can understand exactly why you took the trade without relying on memory.
In my own routine, I found that I didn't need a 20-minute journal entry after every trade. A few structured fields and two or three honest sentences were usually enough. Once I simplified the process, I could complete most entries in under five minutes, which made it much easier to stay consistent.
If your journal only shows entry price, exit price, and profit, you're missing most of the story. The goal isn't to collect numbers. It's to build a record you can learn from.
Here's what I include in every trade.
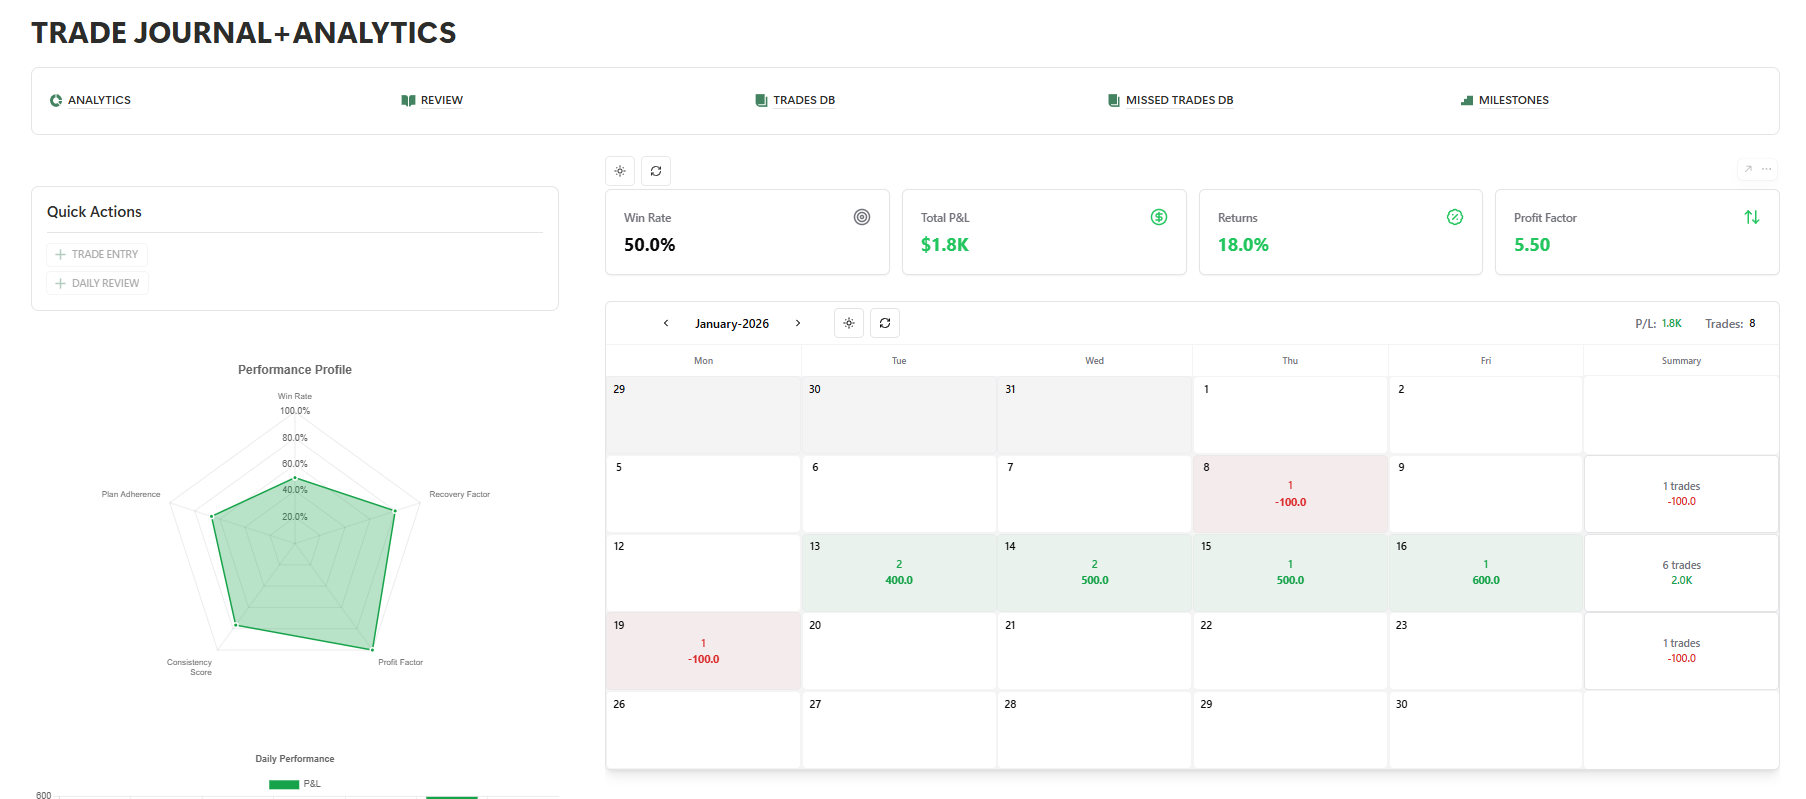
Basic trade information
Start with the facts. These details create the foundation for every review.
At a minimum, record:
Date and time
Market or asset (EUR/USD, BTC/USD, AAPL, ES futures, etc.)
Long or short position
Entry price
Exit price
Position size
Profit or loss
Trade duration
I also save a screenshot of the chart before entering and another after closing the trade.
The screenshots often teach me more than the numbers. Months later, I can instantly see whether the setup was clean or whether I forced an entry because I was eager to trade.
Strategy information
Every trade should have a reason behind it.
If you can't explain why you entered in one or two sentences, you probably shouldn't have taken the trade.
This section usually includes:
Strategy or setup name
Entry trigger
Timeframe used for analysis
Confirmation signals
Market conditions (trending, ranging, high volatility, low volatility)
Planned exit conditions
For example, instead of writing "Bought because price looked strong," I prefer something like:
"Entered after a pullback to the 20 EMA during an established uptrend. Volume increased above the previous three candles, and the breakout closed above resistance."
That sentence gives me something I can evaluate later. The first one doesn't.
Risk management metrics
A good journal doesn't just track profits. It tracks how much risk you accepted to earn those profits.
Some of the metrics I review most often are:
Account risk per trade
Stop-loss distance
Take-profit target
Planned risk-to-reward ratio
Actual risk-to-reward ratio
Percentage gain or loss
Maximum favorable excursion (how far the trade moved in your favor before closing)
Maximum adverse excursion (how far it moved against you)
I didn't start tracking these until much later, and I wish I had done it sooner.
One review showed that many of my profitable trades reached a 3:1 reward-to-risk ratio, yet I kept closing them around 1.5:1 because I got nervous. Without those records, I would have blamed the strategy instead of my own trade management.
Trading psychology
Trading psychology is the section many traders skip.
It's also the one I've learned the most from.
Markets don't know how you feel, but your decisions certainly do.
After reviewing 150+ journal entries, I found that the same three emotional triggers appeared repeatedly: fear of missing out, frustration after a loss, and hesitation after a previous losing streak.
Questions I usually answer include:
Did I follow my trading plan?
Was I confident or hesitant?
Did I feel fear, greed, frustration, or overconfidence?
Was I distracted?
Did I make any impulsive decisions?
Some entries are only a few words.
"Ignored my entry rules because I didn't want to miss the move."
Others are longer if something unusual happened.
The goal isn't to write a diary. It's to capture the emotions that influenced the trade before they're forgotten.
Behavioral finance research has reached a similar conclusion. Large-scale analysis of more than 28.5 million trades found consistent evidence of loss aversion - traders tend to hold losing positions for too long while closing profitable trades too early. Recording emotions alongside each trade makes these habits easier to recognize before they become expensive patterns. - Source
Review notes
Closing a trade shouldn't be the end of the process.
The real value comes from reviewing it with fresh eyes.
A few hours later—or sometimes over the weekend—I revisit each trade and answer a simple question:
Would I take this trade again under the same conditions?
If the answer is yes, I explain why.
If the answer is no, I identify what went wrong and what I'll do differently next time.
My review notes usually cover:
What I executed well
What mistakes I made
Whether I followed my trading plan
What I learned
One specific action to improve on the next trade
I've found that keeping this section short works best. One or two clear lessons are easier to remember than a page of observations that I'll never read again.
A trading journal doesn't become valuable because it's detailed. It becomes valuable because every entry helps you make a better decision on the next trade.
Trading Journal vs. Trade History
When I first started trading, I assumed my broker's trade history was all I needed.
It wasn't.
A trade history tells you what happened. A trading journal explains why it happened.
That's a big difference.
Your broker can show that you bought EUR/USD at 1.1050 and closed the position twenty minutes later for a $120 profit. What it can't tell you is why you entered early, why you ignored your original take-profit level, or why you hesitated before placing the order.
Those details matter because they're the ones you can actually improve.
Here's how the 2 compare:
Feature | Trading Journal | Broker Trade History |
Manual notes | Yes. You record the reason for the trade, observations, screenshots, and lessons learned. | No. Only trading data generated by the platform is available. |
Trade execution data | Can include it, but you enter or import the information yourself. | Automatically records entry, exit, position size, price, and timestamps. |
Psychology | Yes. You can document emotions, confidence level, discipline, and decision-making. | No psychological context is recorded. |
Trade review | Yes. You can revisit each trade and document what worked, what didn't, and what to improve. | Limited. Most platforms stop at execution records. |
Performance analysis | Lets you analyze performance by strategy, market condition, trading session, risk level, or any custom metric you track. | Usually limited to basic metrics such as profit, loss, and account balance. |
Strategy evaluation | Helps determine whether a strategy is profitable and whether poor execution affected the results. | Doesn't explain whether the strategy or the trader caused the outcome. |
Brokerage reports (like the CFTC) are useful for formally documenting executed trades, but they are not designed to assess decision quality.
They typically record prices, trade times, commissions, and actual profits or losses. They don't record whether you followed your trading plan, hesitated out of fear, or exited trades early after seeing a temporary price drop. Those observations should come from your own trading journal, which is why many experienced traders use both together rather than considering them as alternatives.
If I had to choose only one, I'd still keep my broker's trade history because it's the official record of every transaction.
But I wouldn't stop there.
One trade from my journal still stands out. I closed the position with a profit, so my broker marked it as a successful trade. Looking at the chart later, I realized I had entered before my setup was fully confirmed. The trade worked because the market happened to move in my favor, not because I made a good decision.
Without my journal, I would have counted that as a win.
With my journal, I counted it as a mistake.
That small change in perspective made a bigger difference than the profit itself.
Think of your broker's trade history as a bank statement. It tells you where the money went.
A trading journal is closer to a coach sitting beside you after the market closes, pointing out the habits you didn't notice while the charts were moving. One records transactions. The other helps you become a better trader.
How to start a Trading Journal
Starting a trading journal is surprisingly easy.
Sticking with it is the hard part.
I've tried keeping detailed journals with more than 30 columns and color-coded spreadsheets. They looked impressive for about a week.
The problem was that completing one trade entry took too long. After a few busy trading days, I started leaving entries unfinished. Within a couple of weeks, the journal became inconsistent.
I eventually cut the template down to the fields I actually reviewed. That change made a bigger difference than adding another performance metric ever did.
Then I stopped updating them because they took too much time.
What finally worked was keeping the process simple. Record the important details after every trade, then review them on a regular schedule. That's enough to build a journal you'll actually use.
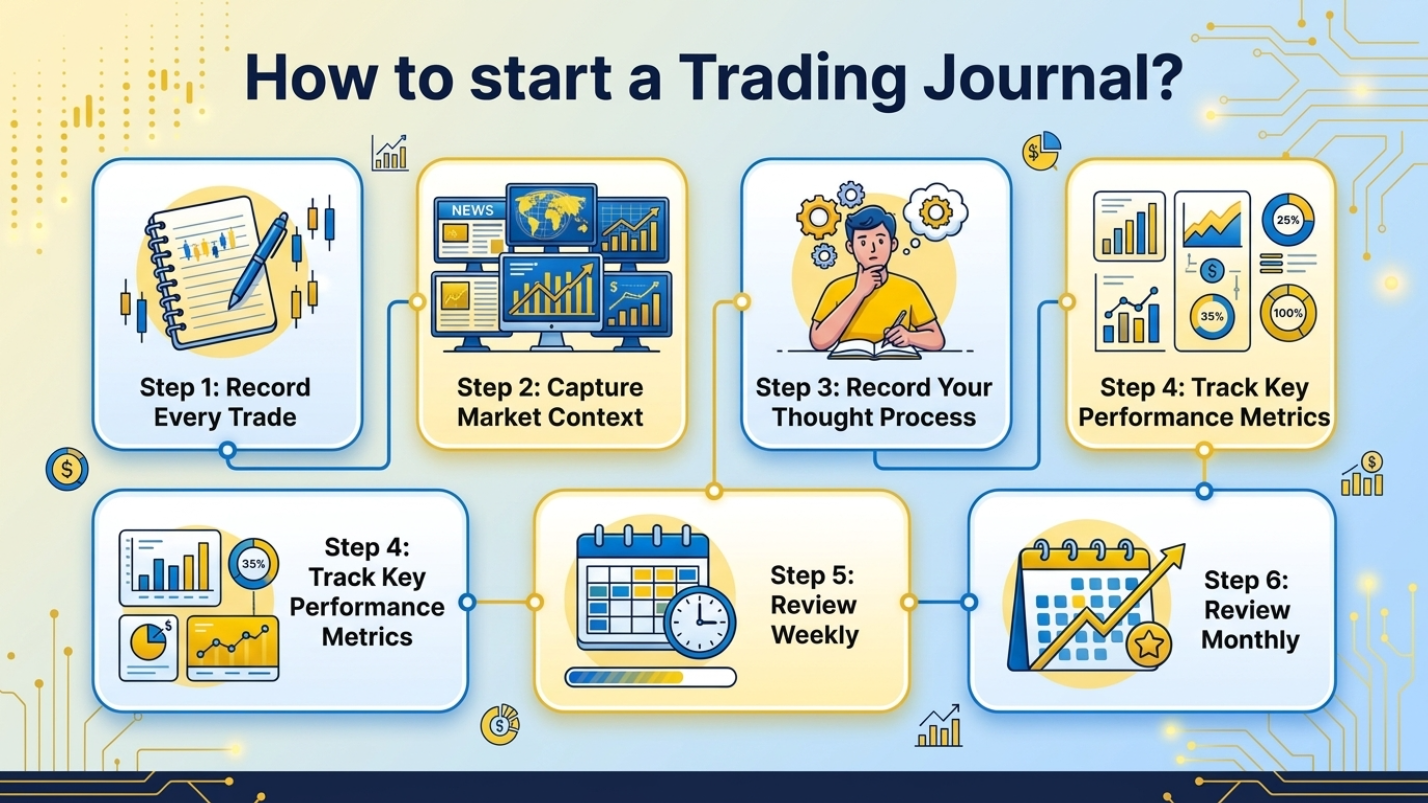
Step 1: Record every trade
The first rule is simple: don't cherry-pick your trades.
Log the winners, the losers, and the ones you'd rather forget.
If you only record your best trades, your journal becomes a highlight reel instead of a learning tool.
For each trade, include the basics:
Date and time
Asset
Long or short position
Entry and exit prices
Position size
Profit or loss
Consistency matters more than perfection. Even if you're busy, spend a few minutes updating your journal while the trade is still fresh.
Step 2: Capture market context
The same strategy can produce very different results under different market conditions.
That's why I always record what the market looked like before I entered.
Some notes I usually add include:
Trending or ranging market
High or low volatility
Major economic news scheduled
Trading session (Asian, London, or New York)
Support and resistance nearby
Overall market sentiment
These details often explain why a setup worked one day and failed the next.
Step 3: Record your thought process
This is the part I value most.
Prices tell you what happened. Your notes explain why you acted.
I don't write long paragraphs. Two or three honest sentences are usually enough.
For example:
"Waited for a pullback to support. Entered after the bullish engulfing candle closed. Almost skipped the trade because of the previous loss, but the setup matched my plan."
Or sometimes the note is much shorter.
"Entered out of boredom."
That single sentence has saved me from repeating the same mistake more than once.
Step 4: Track key performance metrics
Individual trades don't tell the whole story. Performance metrics help you measure consistency across dozens or even hundreds of trades.
Here are the numbers I review most often.
Win Rate
Win rate is the percentage of trades that close with a profit.
A high win rate looks good, but it doesn't automatically mean you're profitable. A strategy that wins 80% of the time can still lose money if the losing trades are much larger than the winners.
Profit Factor
Profit factor compares your total gross profit with your total gross loss.
For example, if your winning trades earn $4,000 and your losing trades total $2,000, your profit factor is 2.0.
I like this metric because it shows whether the overall strategy has an edge instead of focusing on a handful of trades.
Expectancy
Expectancy estimates how much you can expect to gain or lose per trade over the long run.
It combines your win rate with the average size of your winning and losing trades.
You don't have to calculate it manually every day. Many spreadsheet templates and trading journal tools do the math automatically. I still review it every month because it gives a better picture than looking at account balance alone.
One mistake I see quite often is traders focusing almost entirely on win rate. A strategy that wins 80% of the time can still lose money if the losing trades are much larger than the winners. That's one reason many experienced trading educators pay more attention to expectancy and R multiples than win rate alone.
According to the Van Tharp Institute, expectancy represents the average R multiple generated over a series of trades. Rather than asking "How often do I win?", expectancy answers a more useful question: "How much can I expect to make for every unit of risk over the long run?" The institute also recommends evaluating expectancy over at least 30 trades, with 100–200 trades providing a much more dependable sample.
Average Winner
This metric shows the average profit from your winning trades.
If the number starts falling, I ask myself a simple question:
Am I taking profits too early?
Sometimes the answer is yes.
Average Loser
Average loser measures the average loss across losing trades.
A sudden increase usually points to poor discipline rather than a strategy problem.
For me, it's often a sign that I moved my stop-loss or increased my position size without a good reason.
Drawdown
Drawdown measures how much your account declines from its previous peak before recovering.
Every trader experiences drawdowns.
Tracking them helps you answer an important question:
Was this losing streak within my normal range, or did I change something that made my performance worse?
Without historical records, it's difficult to tell the difference.
Step 5: Review your journal every week
I don't wait until the end of the month to review my trades.
Over a three-month period, I completed 12 weekly reviews and noticed that the same two mistakes appeared repeatedly during the first few weeks. By the end of the period, those mistakes had become much less frequent.
I'm usually looking for answers to a few simple questions:
Which setups performed best?
Did I follow my trading plan?
What mistake showed up more than once?
Did I break any risk management rules?
What should I keep doing next week?
I don't try to fix everything at once.
One improvement per week is enough.
Step 6: Review your journal every month
Weekly reviews help you catch small mistakes before they become habits.
Monthly reviews help you see the bigger picture.
This is when I look beyond individual trades and focus on trends.
For example, I compare:
Performance by strategy
Performance by asset
Performance by trading session
Win rate over time
Average risk-to-reward ratio
Changes in drawdown
Sometimes the results surprise me.
More than once, I discovered that a strategy I was close to abandoning was actually profitable. The problem wasn't the setup. I had been trading it during market conditions where it historically performed the worst.
That realization didn't come from one trade.
It came from reviewing a month's worth of data instead of relying on memory.
A trading journal isn't something you fill out once and forget. The real value comes from reviewing it regularly, asking better questions, and making small adjustments that add up over time.
Trading Journal example
When I first started journaling, I made one mistake that almost defeated the purpose.
I only recorded the numbers.
At the end of the week, I could see my entry price, exit price, and profit. What I couldn't remember was why I took the trade or whether I actually followed my plan.
That changed after I began adding a few notes to every entry. It took less than five minutes, but those notes often explained my results better than the chart itself.
Here's an example of what one journal entry might look like:
Category | Example Entry |
Date | July 8, 2026 |
Market | EUR/USD |
Direction | Long |
Strategy | Pullback in an established uptrend |
Timeframe | 1-hour for trend, 15-minute for entry |
Entry Price | 1.1765 |
Stop-Loss | 1.1735 |
Take-Profit | 1.1825 |
Exit Price | 1.1818 |
Risk-to-Reward | Planned: 1:2 • Actual: 1:1.8 |
Position Size | 1 standard lot |
Result | 53 pips |
Market Context | Strong bullish trend after higher-than-expected Eurozone PMI data. Price pulled back to the 20 EMA before resuming higher. |
Reason for Entry | Trend remained intact. Bullish engulfing candle formed at support with increasing volume. Setup matched my trading checklist. |
Emotions | Felt confident before entering. Considered taking profits early after a small pullback but stayed with the original plan. |
What Went Well | Waited for confirmation instead of chasing the breakout. Position size matched my risk rules. |
What Needs Improvement | Could have held the position until the original target instead of exiting after seeing temporary selling pressure. |
Action for Next Trade | Trust the predefined exit plan unless market structure changes. |
Looking at this entry, the profit isn't what catches my attention.
The last three rows do.
A month later, I probably won't remember where EUR/USD traded that morning. I will remember that I exited early because I became uncomfortable during a normal pullback.
That's the kind of lesson that carries over to future trades.
You don't need a complicated template to capture these insights.
If you're using Excel or Google Sheets, create separate columns for your trade details, market context, emotions, and review notes. If you're using dedicated trading journal software, most of these fields are already built in. The important part isn't the tool, it's developing the habit of completing each entry while the trade is still fresh in your mind.
Over time, those individual entries become something much more valuable than a list of trades. They become a record of how your decision-making evolves. And in my experience, that's where the biggest improvements usually begin.
Common Trading Journal mistakes
Keeping a trading journal is one thing. Using it well is another.
I've made most of the mistakes below at least once. The frustrating part is that none of them seemed like a big deal at the time. Over a few months, though, they quietly reduced the value of my journal.
The good news is that they're all easy to fix once you recognize them.
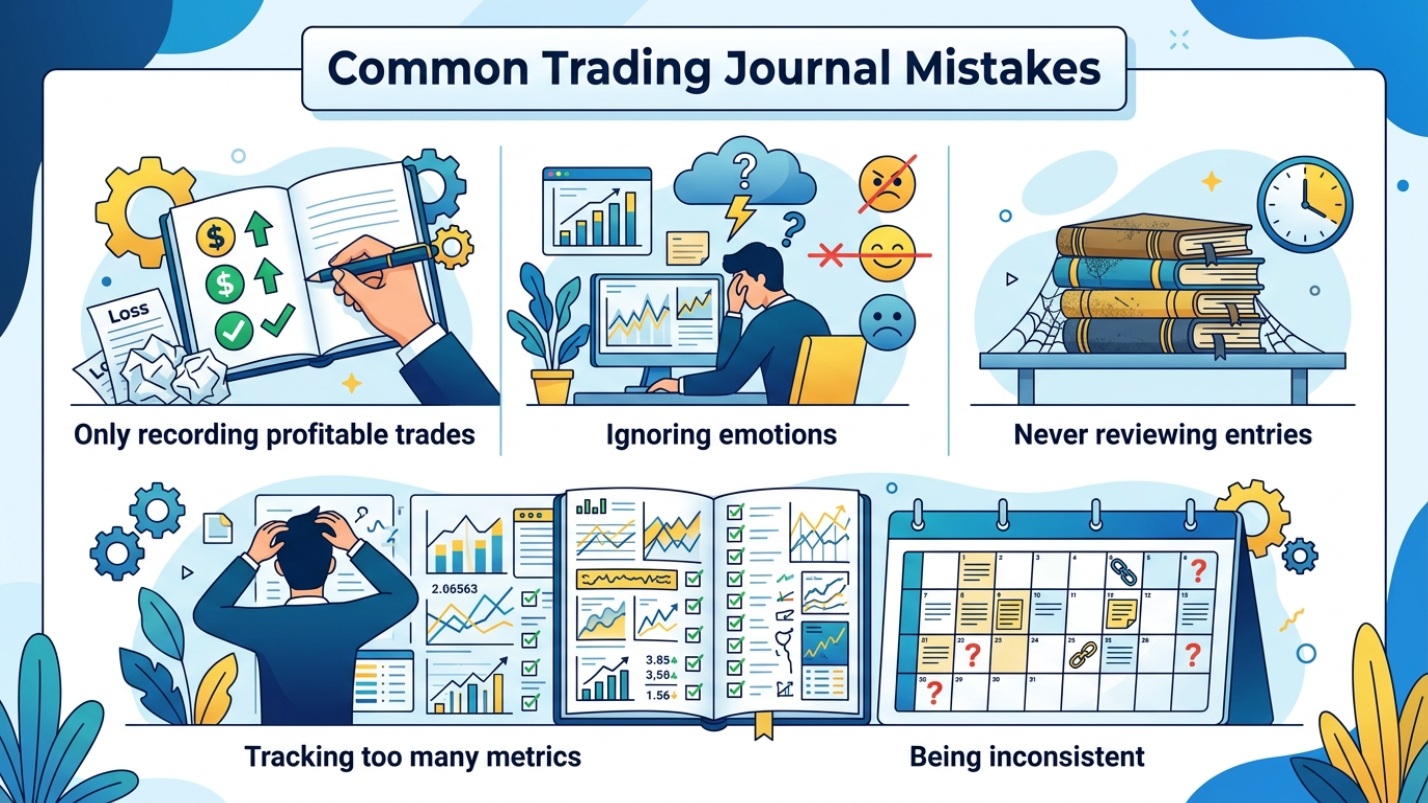
Only recording profitable trades
Nobody enjoys revisiting a bad trade.
It's tempting to skip the losses and move on.
I did that early on because I thought the winning trades would teach me everything I needed to know. They didn't.
The losing trades usually contained the most valuable lessons. They showed where I ignored my checklist, entered too early, or let emotions take over.
A journal filled with winners doesn't tell the whole story. It tells the version of the story you'd like to remember.
Ignoring emotions
Many traders treat emotions as something separate from trading.
I don't.
Fear, greed, frustration, and overconfidence influence almost every trading decision, whether we notice them or not.
I've looked back at trades that seemed perfectly reasonable until I read my own notes:
"Didn't want to miss the move."
That sentence explained the trade better than any technical indicator.
You don't need to write a page about your feelings. A few honest words are enough to reveal patterns that charts never will.
Never reviewing entries
A journal that never gets reviewed is little more than storage.
I've seen traders spend months logging every trade, only to close the spreadsheet and never look at it again.
That's like recording every workout but never checking whether you're getting stronger.
The review is where the learning happens.
Even a short review at the end of each week can reveal habits that are almost impossible to spot while you're focused on live markets.
Tracking too many metrics
More data doesn't always lead to better decisions.
At one point, my journal had more than thirty columns.
I tracked everything.
Most of it never influenced how I traded.
Eventually, I simplified the journal and kept only the metrics I actually reviewed. Updating it became much faster, and I was far more likely to stay consistent.
If you're just getting started, focus on information that helps you answer practical questions, such as:
Why did I enter?
Did I follow my plan?
How much did I risk?
What can I improve next time?
You can always add more metrics later if they serve a clear purpose.
Being inconsistent
This is probably the biggest mistake of all.
A journal only works if you keep it up to date.
Skipping one trade doesn't seem like a problem. Skipping a week turns into skipping a month, and before long, you've lost the habit entirely.
I've found that the best routine is also the simplest.
Close the trade.
Spend five minutes updating the journal.
Move on.
Trying to reconstruct trades days later rarely works. The details fade, and the emotions that influenced your decisions disappear even faster.
Types of Trading Journals
There isn't a single "best" trading journal.
The right choice depends on how you like to work and how much detail you want to track.
Once I was logging more than 100 trades per month, the time required to manually maintain my spreadsheet became noticeable enough that I started looking for more automated options. Each has strengths, and each has a few trade-offs.
Excel Spreadsheet: Excel gives you complete control. You decide which columns to include, how to calculate performance metrics, and how your dashboard looks. It's a great option if you enjoy building your own tracking system or want custom reports that match your trading style. The downside is maintenance. You'll need to create formulas, update layouts, and troubleshoot errors if something breaks.
Google Sheets: Google Sheets offers many of the same benefits as Excel, but with one major advantage: it's available from almost anywhere.I like using it when I want to review trades on a different computer or make a quick note from my phone. Sharing the journal with a mentor or trading partner is also much easier since multiple people can access the same file without sending updated versions back and forth. The main limitation is that very large spreadsheets can become slower than Excel, especially if you've added complex formulas or charts.
Notebook: Some traders still prefer pen and paper. I understand why. Writing by hand slows you down just enough to think about the trade instead of rushing to the next one. A notebook also removes distractions. There are no charts, notifications, or extra tabs competing for your attention. The drawback is that searching old entries or calculating performance metrics takes much longer than it does with a digital journal.
PDF: A PDF journal works well if you like structured templates. You can print it, fill it out digitally, or save completed pages for future reference. I've used PDF templates during travel when I didn't want to carry my laptop. They were simple, but they also required more manual work once I wanted to analyze my results. They're a solid choice for record-keeping, though they're less practical for long-term performance analysis.
Trading Journal Software: Dedicated trading journal platforms automate much of the work. Many can import trades directly from supported brokers or trading platforms, calculate performance metrics, organize screenshots, and generate reports based on strategy, asset, trading session, or other filters.
That convenience comes at a cost.
Some platforms require a monthly subscription, and available features vary depending on the broker integrations they support. If your broker isn't compatible, you may still need to import trades manually.
For active traders with hundreds of trades each month, the time savings can easily justify the subscription. If you're placing only a handful of trades each week, a spreadsheet may give you everything you need without adding another recurring expense.
In the end, the format matters less than the habit. A simple journal that you update after every trade will almost always be more valuable than an advanced system you stop using after two weeks.
Best metrics to track in a Trading Journal
Once I had logged a few hundred trades, I realized something important.
Looking at individual trades wasn't enough. The real insights came from tracking the right metrics over time. Some numbers looked impressive but didn't help me improve. Others completely changed the way I evaluated my performance.
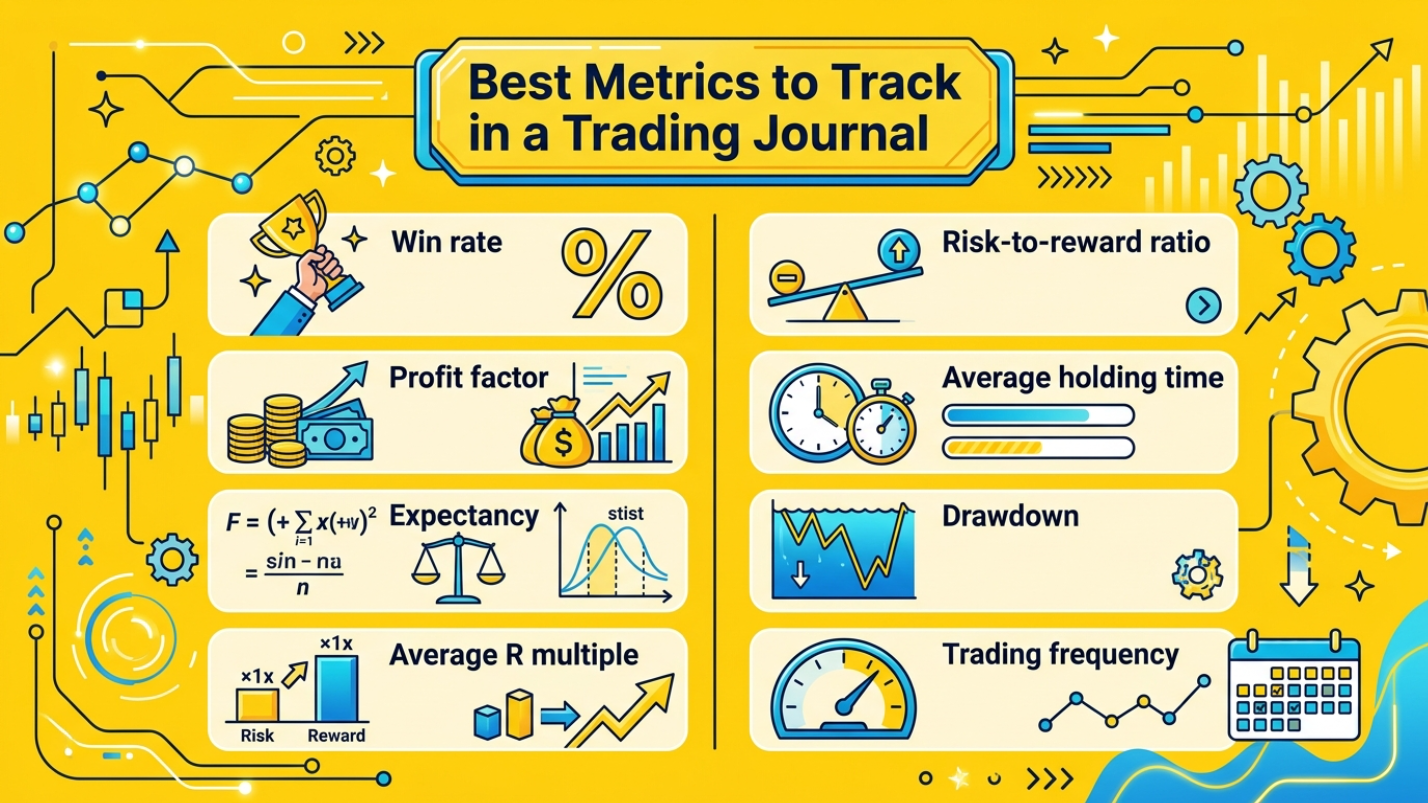
These are the metrics I pay the closest attention to.
Win Rate: This tells you what percentage of your trades end in profit. It's one of the first metrics traders look at, but I never judge a strategy by win rate alone. I've seen strategies with a 40% win rate outperform others that won 70% of the time because the average winner was much larger than the average loser.
Profit Factor: Profit factor compares your total gross profit with your total gross loss. For example, if your winning trades generate $6,000 and your losing trades total $3,000, your profit factor is 2.0. I like this metric because it answers a simple question: Is my strategy making more money than it's giving back?
Expectancy: Expectancy estimates the average amount you can expect to gain or lose per trade over a large sample. It combines your win rate with the size of your average winners and losers. If expectancy remains positive after hundreds of trades, your strategy likely has an edge. If it's negative, adding more trades usually won't solve the problem.
Average R Multiple: I didn't start tracking R multiples until much later, and I wish I had done it sooner. Instead of measuring trades in dollars, R multiples measure every result relative to the initial risk. If I risk $200 and make $600, that's +3R. If I lose the planned $200, that's -1R. Measuring performance this way makes it much easier to compare trades of different sizes.
Risk-to-Reward Ratio: This metric compares your planned profit target with the amount you're willing to lose. Suppose you risk 30 pips to make 90 pips. That's a 1:3 risk-to-reward ratio. After reviewing my journal, I noticed many of my winning trades never reached their intended target because I closed them early. That wasn't a strategy issue. It was an execution issue.
Average Holding Time: Holding time often reveals habits you don't notice during live trading. For example, you may discover that your most profitable swing trades stay open for several days, while trades closed within fifteen minutes rarely perform well. That kind of pattern is difficult to spot without historical data.
Drawdown: Every strategy goes through losing periods. Drawdown shows how much your account declined from its previous peak before recovering. I review this metric every month because it helps me distinguish between a normal losing streak and a genuine problem with my trading. If the drawdown is much larger than my historical average, I know it's time to investigate what changed.
Trading Frequency: More trades don't automatically lead to better results. In fact, my journal has shown the opposite more than once. During some months, my highest returns came from taking fewer, higher-quality setups. Tracking how many trades you place each day or week can reveal whether you're following your plan or simply trading because the market is open.
No single metric tells the whole story.
I always review them together. A lower win rate may be perfectly acceptable if the average winner is much larger than the average loser. Likewise, a high profit factor means very little if it comes from a small sample of trades.
Over time, these metrics become more than numbers on a spreadsheet. They become feedback. And in my experience, honest feedback is one of the fastest ways to grow as a trader.
Best practices for maintaining a Trading Journal
A trading journal only works if you keep it updated and actually use it. I've changed my approach several times over the years, and the biggest improvements didn't come from adding more data. They came from building a routine I could stick with.
Here are a few habits that have made the biggest difference for me.
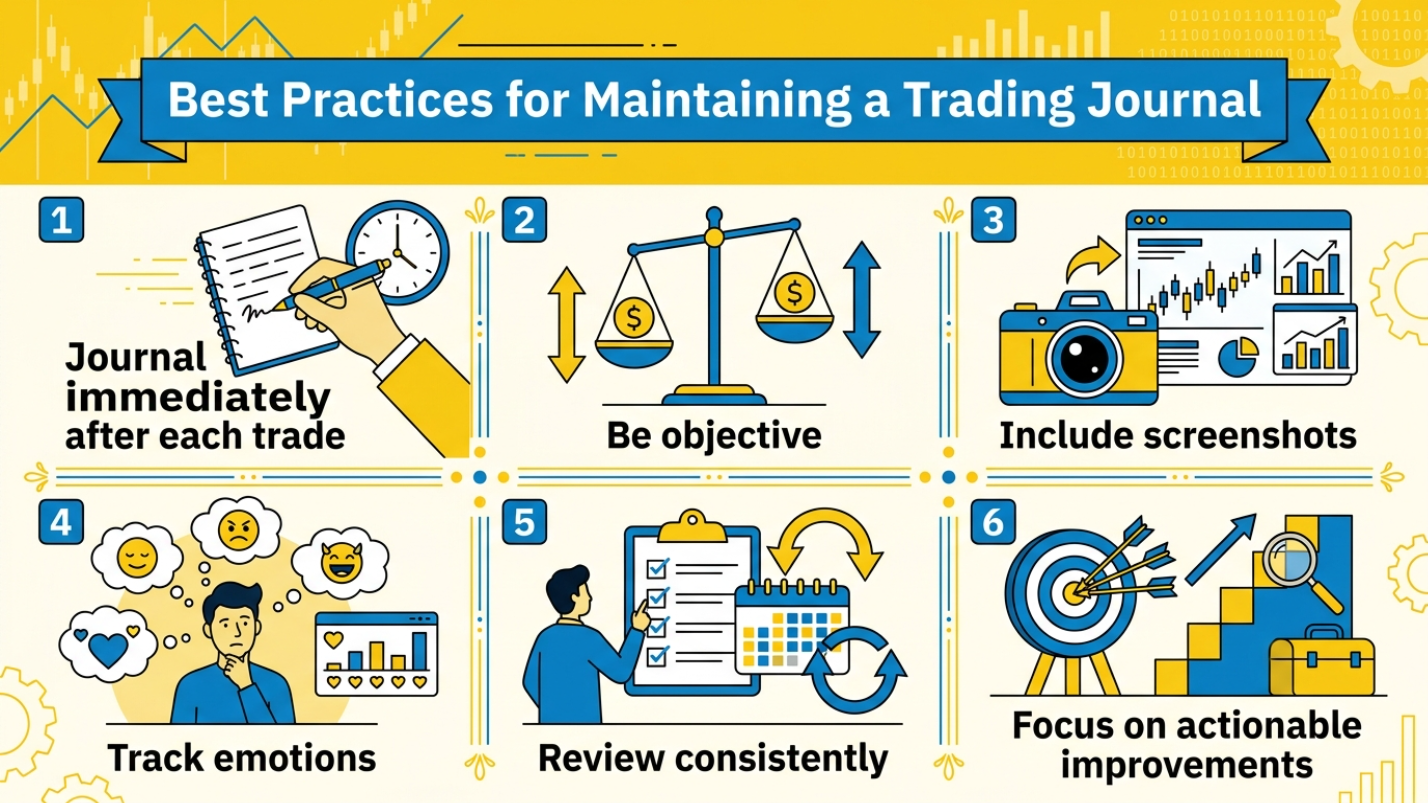
Journal immediately after each trade
Don't wait until the end of the day. I learned this the hard way. A trade that feels crystal clear right after closing becomes surprisingly difficult to remember a few hours later. I try to record everything while the details are still fresh, especially my reasoning and emotions. It usually takes less than five minutes.
Be objective
This is easier said than done. After a winning trade, it's tempting to praise every decision you made. After a loss, it's just as easy to blame the market. I try to judge the execution instead of the outcome. If I followed my plan and still lost, I record it as a well-executed trade. If I ignored my rules and made money anyway, I treat it as a mistake worth fixing.
Include screenshots
I never realized how helpful screenshots were until I started reviewing older trades. A chart captures details that numbers can't. I save one image before entering a trade and another after closing it. Looking at both side by side often explains my decisions much faster than reading a page of notes.
Track emotions
You don't need to write a personal diary. A few honest words are enough. Notes like "hesitated after two losses" or "closed early because I got nervous" have helped me identify recurring habits that would have been easy to overlook.
Review consistently
Recording trades is only half the process. I set aside time every weekend to review the past week's trades and another session at the end of each month to look for longer-term trends. Those reviews usually reveal one or two habits worth improving before they become bigger problems.
Focus on actionable improvements
I always finish a review with one specific takeaway. Maybe I need to wait for stronger confirmation before entering, reduce position size during volatile sessions, or stop moving my stop-loss. Keeping the focus on a single improvement makes it much more likely that I'll actually apply it in my next trade.
Trading Journal templates
When I started journaling, I spent more time building spreadsheets than reviewing trades.
Looking back, that was a mistake.
A good template shouldn't make journaling feel like another job. It should give you enough structure to stay organized while letting you focus on what actually matters—learning from each trade.
If you're creating your own template, I'd include these sections.
Trade Details: Record the basics first. Date, market, direction (long or short), entry price, exit price, stop-loss, take-profit, position size, and realized profit or loss. These fields become the foundation for every review.
Setup & Market Context: Add the strategy name, timeframe, market condition (trending or ranging), and the reason for entering the trade. I also like including a checklist that confirms whether all entry criteria were met. It makes rule violations much easier to spot later.
Risk Metrics: Leave room for numbers such as risk-to-reward ratio, R multiple, percentage risked, and maximum drawdown. Tracking these metrics over time gives you a much clearer picture than simply watching your account balance.
Psychology & Review Notes: This is the section I revisit most often. A few honest comments about your confidence level, emotional state, and execution quality can explain patterns that raw numbers never will. Finish each entry with one lesson or one action you'll carry into the next trade.
You can build a template from scratch in Excel or Google Sheets, but that takes time. You'll need to create formulas, test calculations, and organize everything into a layout that's actually easy to use.
If you'd rather skip that process, TradeZully offers a free Trading Journal Template that already includes the core fields, automatic calculations for key performance metrics, and a clean layout that's easy to update after every trade. It's designed for stocks, forex, crypto, futures, and options, and works in both Excel and Google Sheets.
You can download it here: Free Trading Journal Template by TradeZully
Whether you use that template or build your own, don't get caught chasing the "perfect" journal. I've learned that a simple template you complete after every trade is far more valuable than an elaborate one that sits untouched after the first week.